
The Importance Of Mapping Bicycling Data
By: Kiran Herbert, PeopleForBikes’ content manager
Tools like BikeMaps.org and PeopleForBikes’ Bicycle Network Analysis help planners make investment decisions that prioritize safety.
In case you’ve missed the abundance of less-than-stellar headlines, the pandemic has coincided with a surge in car crashes and deaths. In fact, according to the New York Times, “The United States is enduring its most severe increase in traffic deaths since the 1940s.” Due to vehicle improvements, reductions in speed limits and a crackdown on drunk driving, crashes have declined since the 1960s — although lower-income and BIPOC communities continue to bear the brunt of the violence.
Fast forward to summer 2020. With fewer folks on the roads, aggressive driving became the norm. When more cars returned later in the pandemic, the trend in crashes continued to rise, and between 2019 and 2021 per capita vehicle deaths rose an astonishing 17.5%. The trend has impacted pedestrians as well as bicyclists, who make up a fifth of traffic deaths and are far more vulnerable to dangerous street design and aggressive driving.
In 2014, Trisalyn Nelson, a geography professor and spatial data scientist, was biking when she had a near-miss with a car. It’s estimated that only 20 to 30% of crashes are officially reported, and even less than a decade ago there was no centralized reporting of crash data or near misses for bicyclists. If only a fraction of crashes are reported and you’re an urban planner or policymaker trying to prioritize investments in safer streets, the lack of good data makes it difficult to know where to start.
“At the time, there was this growing popularity of using crowdsourcing to improve data on a bunch of things,” said Nelson, who was then teaching at the University of Victoria, British Columbia. “We really wanted to develop a system that would allow us to curate the individual rider’s experience to try and understand where safety issues occur and how we can better design our on-street infrastructure.”
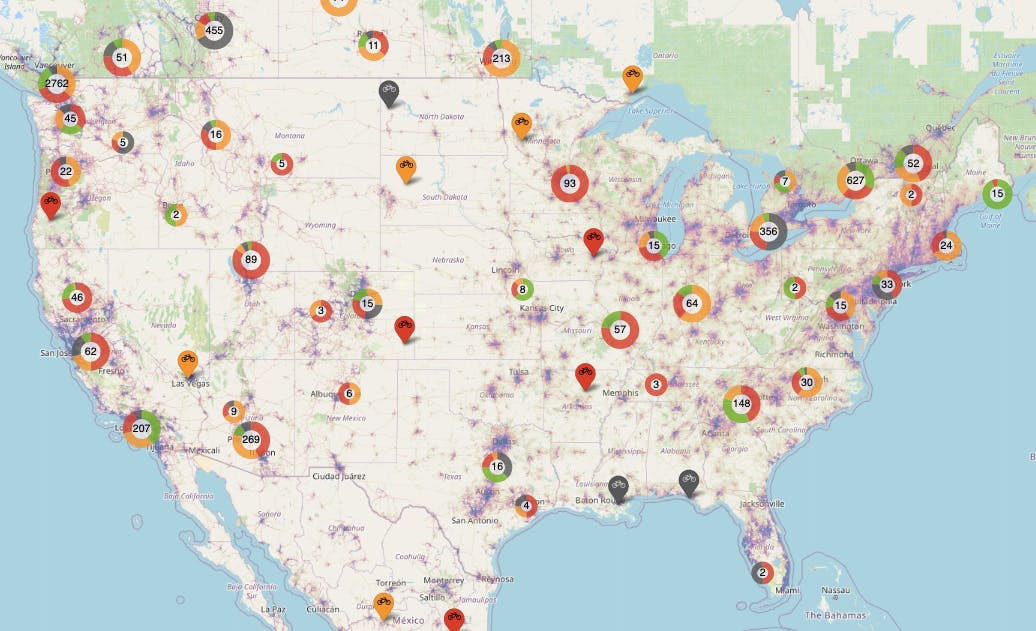
Nelson, alongside colleagues from the Spatial Pattern Analysis & Research (SPAR) Lab, recruited developer Taylor Denouden and graduate student Ben Jestico to build BikeMaps.org, a data resource that maps bike safety outcomes as collisions or near misses. The primary national resource for mapping crashes, the Fatality Analysis Reporting System (FARS) data set, only counts crashes that involve a motor vehicle and a fatality. Some cities collect more comprehensive collision data independently, but there is no national source compiling city-level data. BikeMaps has emerged as one resource to help broaden the definition of safety data and fill in the gaps through crowdsourcing.
The system, which resembles Google Maps, allows a user to scroll to their city, find the location where an incident occurred, and drop a pin, prompting them to answer a series of questions.
“We spent a lot of time working with bike safety researchers and city planners to try and figure out what kind of questions we should ask on the map,” said Nelson. “People can describe what happens and we get some really great descriptions.”
The product team also had developers layer in Strava ridership data, which helps researchers contextualize the safety data. For example, if one bicyclist out of 10 gets in a traffic collision on a street, the street is super unsafe. If one out of 1,000 bicyclists is involved in a crash, the crash risk is much lower. Since data on bicycling exposure is notoriously hard to obtain, BikeMaps turned to Strava to provide a sample of bicycling volumes. In conjunction with other data sources and correcting for any biases in the data, the team is able to paint a more accurate picture of the total number of riders in any given place at different times of the day.
Seed funding for the BikeMaps website was originally provided by the Canadian Automobile Association (Canada’s version of AAA), while the Public Health Agency of Canada invested heavily in its promotion to recruit crowdsourced contributions to the map. Today, Strava remains a close collaborator while funding comes from both Canadian and U.S. sources. Assorted staff, researchers and students maintain the site. BikeMaps.org is currently used in more than 40 countries in five different languages and a version for pedestrians and folks in wheelchairs is currently in the works.
In order to maintain a simple, easy-to-use interface, the website serves solely to crowdsource data rather than display all safety data, even in cases where other crash data is available, such as from police reports or hospital visits. However, the BikeMaps team conducts in-depth research and analysis when partnering with cities, collecting all available data and showcasing “hot spots” — or particularly dangerous areas for bicyclists. Transportation officials can then use the BikeMaps team’s analysis to prioritize infrastructure improvements in targeted areas.
“We really want to help create access to bicycling by making cities safer,” said Nelson. “And the only way to do that is to really empower people making decisions to figure out where they should be making investments.”
The beauty of BikeMaps is that it serves as a call to action for everyday individuals who are passionate about bike safety data, allowing anyone to map their own experience and identify hazards. The project is always looking for champions within communities to advocate for bike safety and provides resources to share and encourage action locally.
As a resource, BikeMaps complements PeopleForBikes’ Bicycle Network Analysis (BNA) tool, which is a major component of our City Ratings. The BNA identifies low-stress bikeways and emphasizes connectivity, focusing on the need to build more high-quality, safe bike networks. BikeMaps focuses on specific safety incidents, which in conjunction with the BNA can help cities better prioritize infrastructure investments for safety and connectivity.
“It’s important to understand where you need to have investment but also where investment will lead to a more connected network,” said Nelson, noting that equity also needs to be considered. “We want to increase safety but with a focus on access. Who needs access to bicycling the most? People who have the least amount of choice in terms of their transportation modes.”
BikeMaps has submitted grant proposals to design and deploy an equity dashboard for transportation decision-making, but that’s still a work in process. Nelson acknowledges that some things — such as income levels and race percentages — are easy to quantify, but other factors that impact access will differ from community to community.
“When it comes to that work, much of the decision-making needs to be done with community partners who are underserved,” said Nelson, emphasizing the need for partnerships between government, nonprofits, academia, and community-based organizations. “We need to make sure the voices we’re trying to serve are at the table and that we’re not just coming from the top down with ideas. But I think that will lead to new challenges around data and that’s where a team like mine can really come in and be helpful.”
Rebecca Davies, PeopleForBikes’ City Ratings program director, sees City Ratings and BikeMaps as complementary resources. She also welcomes additional bike data mapping tools, such as New Orleans’ bike equity index, which incorporates demographic data into bike planning, and Toole Design’s Safer Streets Priority Finder, which calculates injury and fatality risk based on a city’s historical data. In the absence of federal or state governments tracking equity, safety and connectivity information, planners looking to build better bike cities are often forced to create their own datasets or make decisions based on incomplete information. And while the U.S. Department of Transportation is starting to acknowledge the importance of data collection and analysis when it comes to road user safety, more work is needed.
“Ultimately, I hope that we get more complete data on bike infrastructure, ridership, and safety outcomes from the Federal Government,” said Davies. “Until measuring bicycling is a national priority, City Ratings and BikeMaps are two projects helping to fill those gaps.”
Related Topics:

Take Action
